
Episode IV: The Phantom Pressure
Venous Return Wars

The gradient has survived the rebellion. Mean systemic pressure still appears to sit upstream of the right atrium, driving blood home. But as George Brengelmann opens the black box, a troubling question emerges: where, in the flowing circulation, is this pressure actually hiding…?
The pressure that remained
Rothe had returned the elastic state to the circulation. Mean systemic filling pressure (Pms) was not merely the value obtained after the pump stopped; it was the equilibrium expression of the relationship between blood volume and the vascular system containing it. During flow, arterial pressure lay above this equilibrium value and right atrial pressure lay below it. Somewhere between the two, the local pressure therefore had to pass through the numerical value of Pms.
Rothe called this the pivot pressure. It was usually found among the small veins and venules, where much of the systemic blood volume and vascular compliance resided. When cardiac activity changed, compartments on one side of the pivot gained volume while those on the other side lost it. As a description of redistribution, the pivot was useful.
Rothe then gave the numerical correspondence greater physical significance. If pressure in the small veins approximated Pms during flow, perhaps this was where Pms persisted within the circulation. The equilibrium pressure had acquired an approximate anatomical location. From there, it could become the upstream pressure for venous return, opposed downstream by right atrial pressure.
George Brengelmann challenged precisely this kind of interpretation, but not by dismissing Guyton’s work. He regarded Guyton’s graphical analysis of cardiovascular equilibrium as a major advance and accepted the validity of the experimental relationship between flow and right atrial pressure. Guyton’s own models were not simple reservoirs draining through a single venous resistance; they contained networks of compliant compartments and resistive pathways. The problem arose when the reduced equation was treated as though it were a literal picture of the circulation.
A local venular pressure during flow and the common equilibrium pressure that appears after flow stops belong to different states of the system. They may share the same numerical value without being the same physical quantity. Before Pms could be accepted as a pressure source persisting within the flowing circulation, the experiment from which the equation arose had to be reopened.
The question was no longer whether the number existed. It was what, physically, that number represented.
One steady flow, not two
Brengelmann began with a point that had become obscured by the language of venous return. In a steady circulation, cardiac output and venous return are not two separate flows. They are the same flow measured at different positions around a closed loop. Blood is not steadily leaving the veins at one rate while entering the arteries at another. If that occurred, vascular volumes would continue to change.
The term venous return becomes distinct from cardiac output only during transitions. For a brief period, the amount entering a vascular compartment may differ from the amount leaving it. The difference changes the volume contained within that compartment. Once inflow and outflow become equal again, its volume stops changing and a new steady state has been established.
This did not mean that the cardiac and vascular parts of the circulation could not be studied separately. Guyton’s great insight had been to open the loop conceptually. The cardiac subsystem could be examined by asking what flow the heart produced at different right atrial pressures when its other properties were held constant. The vascular subsystem could be examined by imposing different flows and observing the right atrial pressure associated with each one at a fixed vascular state.
When the two subsystems were reconnected, neither relationship determined the other. The circulation settled at the one flow and right atrial pressure compatible with both. The original experiments had therefore revealed an important vascular relationship. The remaining question was what physical process produced it.
Back to the apparatus
Guyton and his colleagues collected blood from the right atrium and passed it through an external collapsible tube—a Starling resistor—to the inlet of a mechanical pump. The pump delivered the blood into the pulmonary artery, and the left heart returned the same flow to the systemic circulation. An external blood reservoir was connected to the apparatus, but its connection was closed while each venous return curve was recorded, so the volume contained within the peripheral vasculature remained fixed.
The only flowmeter was positioned on the outflow side of the pump. Each data point was recorded after the preparation had reached a new steady state. At that moment, pump output, cardiac output and venous return were necessarily equal. The experiment did not measure venous return as a flow distinct from cardiac output. It measured the steady flow through the vascular subsystem and the right atrial pressure accompanying it.
The Starling resistor allowed that pressure to be varied. It consisted of a thin, collapsible tube that was kept partly compressed. At the point where collapse began, the pressure inside the tube was approximately atmospheric. Its height relative to the right atrium therefore established a hydrostatic pressure difference. Raise the resistor above heart level and right atrial pressure had to settle at a positive value. Lower it below the heart and right atrial pressure could become subatmospheric.
But moving the resistor did not alter right atrial pressure in isolation. Suppose it was raised. The right atrium and nearby great veins now had to contain more blood to establish the higher local pressure. Because total systemic vascular volume was fixed, that blood had to come from elsewhere. The distribution of volume and pressure throughout the vasculature changed, and pump output could not remain at its previous value while this occurred.
The original descriptions do not make it entirely clear whether the investigators manually changed the pump setting after each movement of the resistor or whether increased collapse of the tube impaired pump filling and throttled its output. Brengelmann argued that the distinction did not matter. In either case, the recorded point was the final combination of flow and right atrial pressure compatible with the resistor height, the vascular properties and the fixed amount of blood inside the systemic vasculature.
The legitimate conclusion was therefore precise:
At a fixed systemic vascular volume and vascular state, each steady flow was associated with a particular right atrial pressure.
The experiment did not directly reveal a compartment maintained at Pms, delivering blood through a venous resistance against a downstream back pressure. That hydraulic arrangement was an interpretation placed upon the curve.
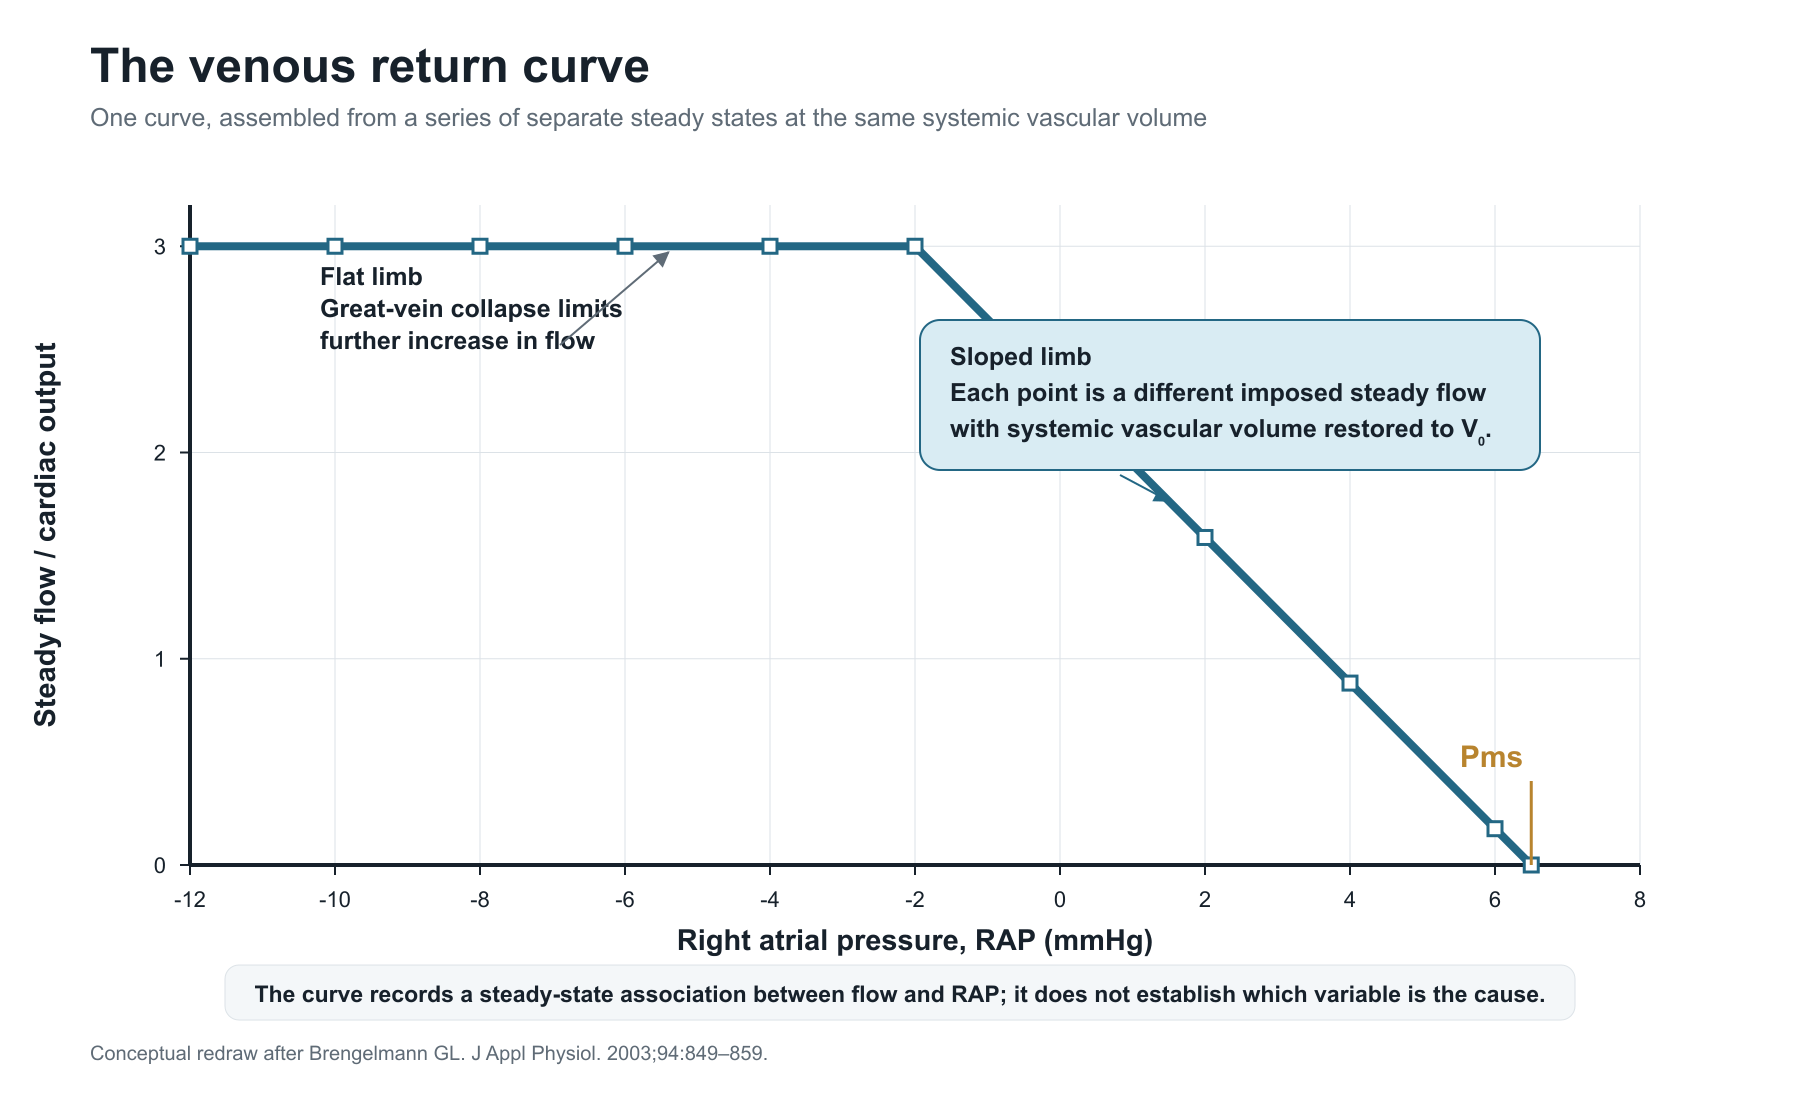
The flat segment at very negative right atrial pressures had a separate explanation. Once the great veins partially collapsed, further reductions in right atrial pressure no longer altered upstream pressure or flow.
The missing variable
The crucial constraint was not simply pressure or flow. It was the distribution of a fixed amount of blood across compliant vascular compartments.
Rothe had already provided the necessary framework. Every compartment contained a volume related to its pressure and elastic properties. If the total volume inside the systemic vasculature was fixed, an increase in one region had to be balanced by an equal decrease elsewhere. The different points on a venous return curve therefore represented different distributions of the same total blood volume.
Consider what happened when the Starling resistor was raised. The higher required right atrial pressure meant that the central veins had to contain more blood. During the transition, their inflow briefly exceeded their outflow and their volume increased. That additional blood came from upstream compartments, whose volumes and pressures fell. Pump flow eventually settled at the lower value compatible with the new pressure and volume distribution.
The reverse process is easier to see by imagining an increase in imposed pump flow. At the first instant, the pump delivers blood into the arterial side faster than the arterial compartment can pass it onward. Arterial volume therefore rises. Because arterial compliance is fixed, arterial pressure rises with it.
At the same time, the pump removes blood from the central venous end faster than it is initially replaced from upstream. Central venous volume falls, and right atrial pressure falls with it. A finite amount of blood has been transferred from the downstream venous compartments to the upstream arterial compartments.
As the imposed pump flow redistributed blood, arterial pressure and volume rose while venous pressure and volume fell. The resulting local pressure differences were those required for progressively greater flow through the intervening resistances. Redistribution continued until the inflow and outflow of each compliant compartment were equal again; in Brengelmann’s lumped model, the same total flow then passed through each serial resistive element.
The new steady state therefore contains more blood on the arterial side and less on the venous side. Arterial pressure lies above Pms; peripheral and central venous pressures lie below it. Because the arterial compartment is stiff, a relatively small gain in arterial volume produces a large increase in pressure. The equal loss from the much more compliant venous system produces a smaller fall in pressure.
Pressure did not appear first and then command blood to move. The physical sequence began with pump action and temporary imbalances between compartmental inflow and outflow. Volume and pressure changed together until the network could transmit the imposed flow steadily:
pump action → transient inflow–outflow imbalance → redistribution of volume and pressure → new steady state
Progressively higher imposed flows therefore required progressively different distributions of the same blood volume. More blood resided upstream, less in the central venous compartments, and right atrial pressure fell.
This was Brengelmann’s central point:
The sloped segment appeared because a fixed total volume was redistributed across compliant vascular compartments at different flow rates, not because a reservoir remained at Pms and drained towards the right atrium.
Reconstructing the curve
Brengelmann made the volume accounting clearer with a hypothetical alternative to Guyton’s apparatus. He removed the Starling resistor and allowed blood from the right atrium to spill through an open tube into an external reservoir. The height of the tube set right atrial pressure. A pump drew blood from the reservoir and returned it to the pulmonary artery.
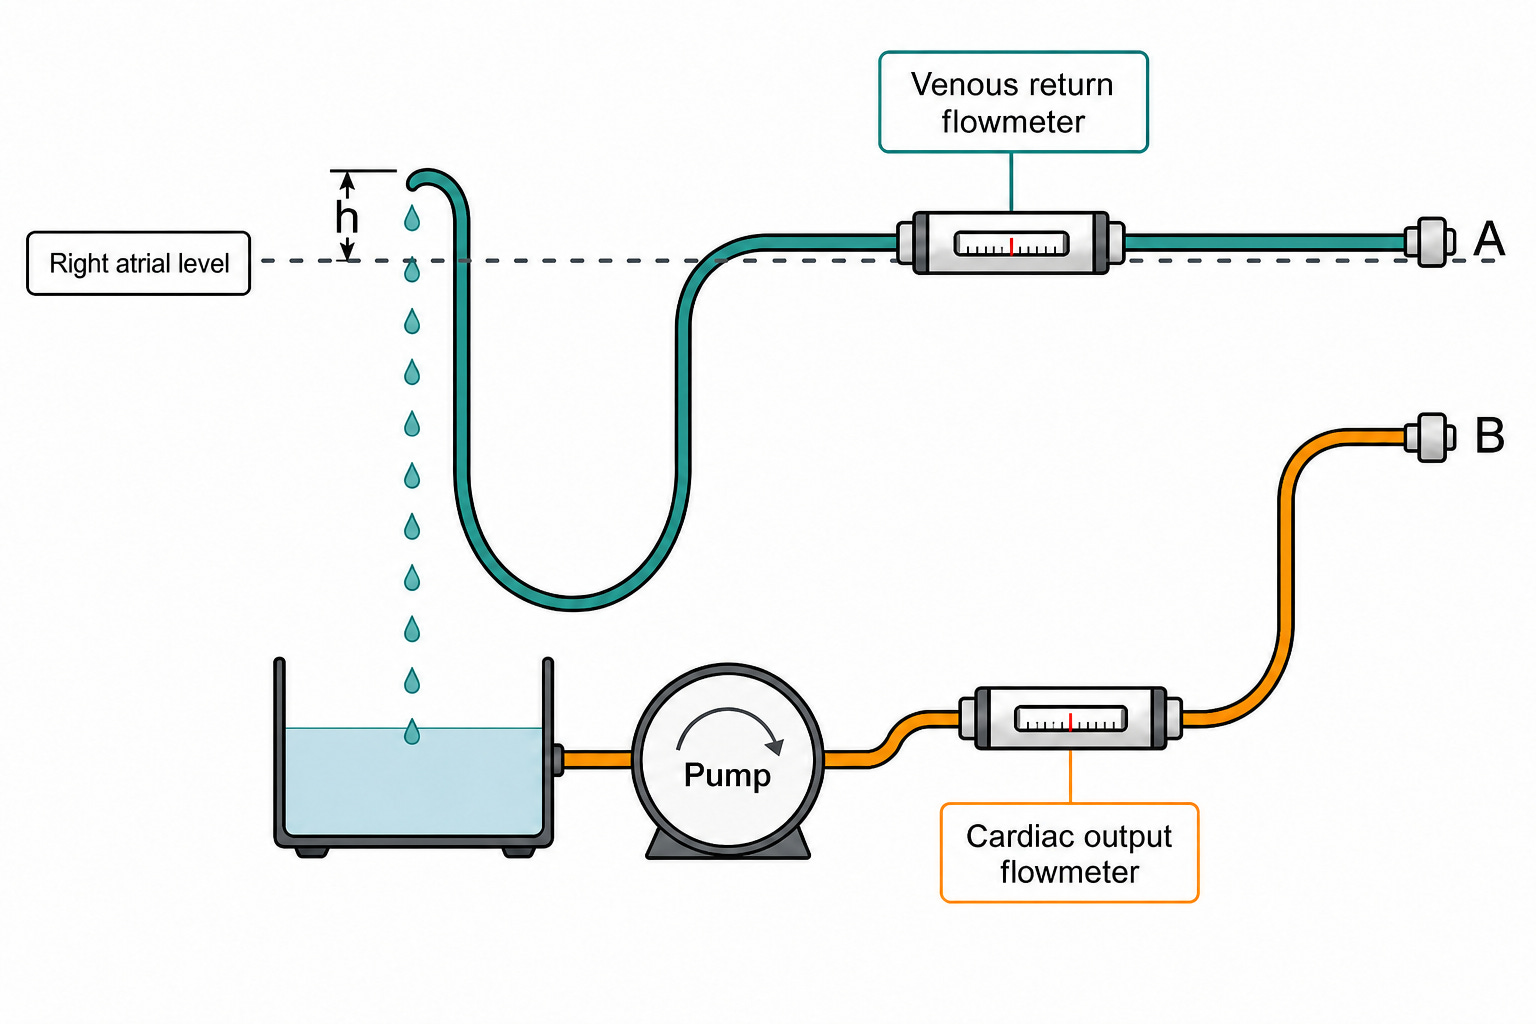
Author’s schematic, redrawn and adapted from the hypothetical apparatus proposed in Fig. 3 of Brengelmann GL. A critical analysis of the view that right atrial pressure determines venous return. J Appl Physiol. 2003;94:849–859. https://doi.org/10.1152/japplphysiol.00868.2002. Original source ©2003 American Physiological Society.
The arrangement looked superficially like a bathtub emptying through a drain. But here the external reservoir was not presented as the source of energy for systemic flow. It served as a visible ledger of how much blood entered or left the peripheral vasculature.
The thought experiment began with the pump stopped and the open tube positioned so that right atrial pressure was equal to the original Pms. With no flow, pressures equilibrated throughout the systemic vasculature, which contained a reference volume that Brengelmann called V0 .
The pump was then started at a chosen flow while the tube remained at the same height. Right atrial pressure therefore remained at Pms. A flowing pressure profile developed upstream: arterial and intermediate pressures rose above Pms, expanding their compliant compartments. The peripheral vasculature now contained more than V0 . The additional blood had come from the external reservoir because, during the transition, pump inflow to the circulation exceeded venous outflow back into it.
V0 was the target systemic vascular volume defining the curve; it was not automatically preserved during every intermediate step. Starting flow while holding right atrial pressure at Pms forced the compliant vasculature to take up additional blood.
Brengelmann then lowered the open tube. Right atrial pressure fell, and venous outflow temporarily exceeded pump inflow. Blood left the vascular compartments and returned to the external reservoir. Once the excess had been removed, the systemic vasculature again contained exactly V0 . Pump flow and venous outflow were once more equal, but right atrial pressure was now below Pms.
At each successive point, pump output could be increased and the tube then lowered until systemic vascular volume returned to V0. Brengelmann noted that the order could equally be reversed: the tube height could be changed first and pump output then adjusted to restore V0. Either sequence recreated the same sloping relationship obtained by Guyton. No compartment maintained at Pms was required. The curve emerged from paired changes in flow and right atrial pressure, real segmental pressure differences, compliant vascular compartments, conservation of blood volume and restoration of the same target vascular volume at each data point.
Looking inside the black box
Brengelmann next examined a conceptual three-compartment model. Its arterial, peripheral venous and central venous compliances were linked by arterial and venous resistive elements. An ideal pump imposed flow, and Brengelmann analysed an equivalent electrical circuit by computer simulation.
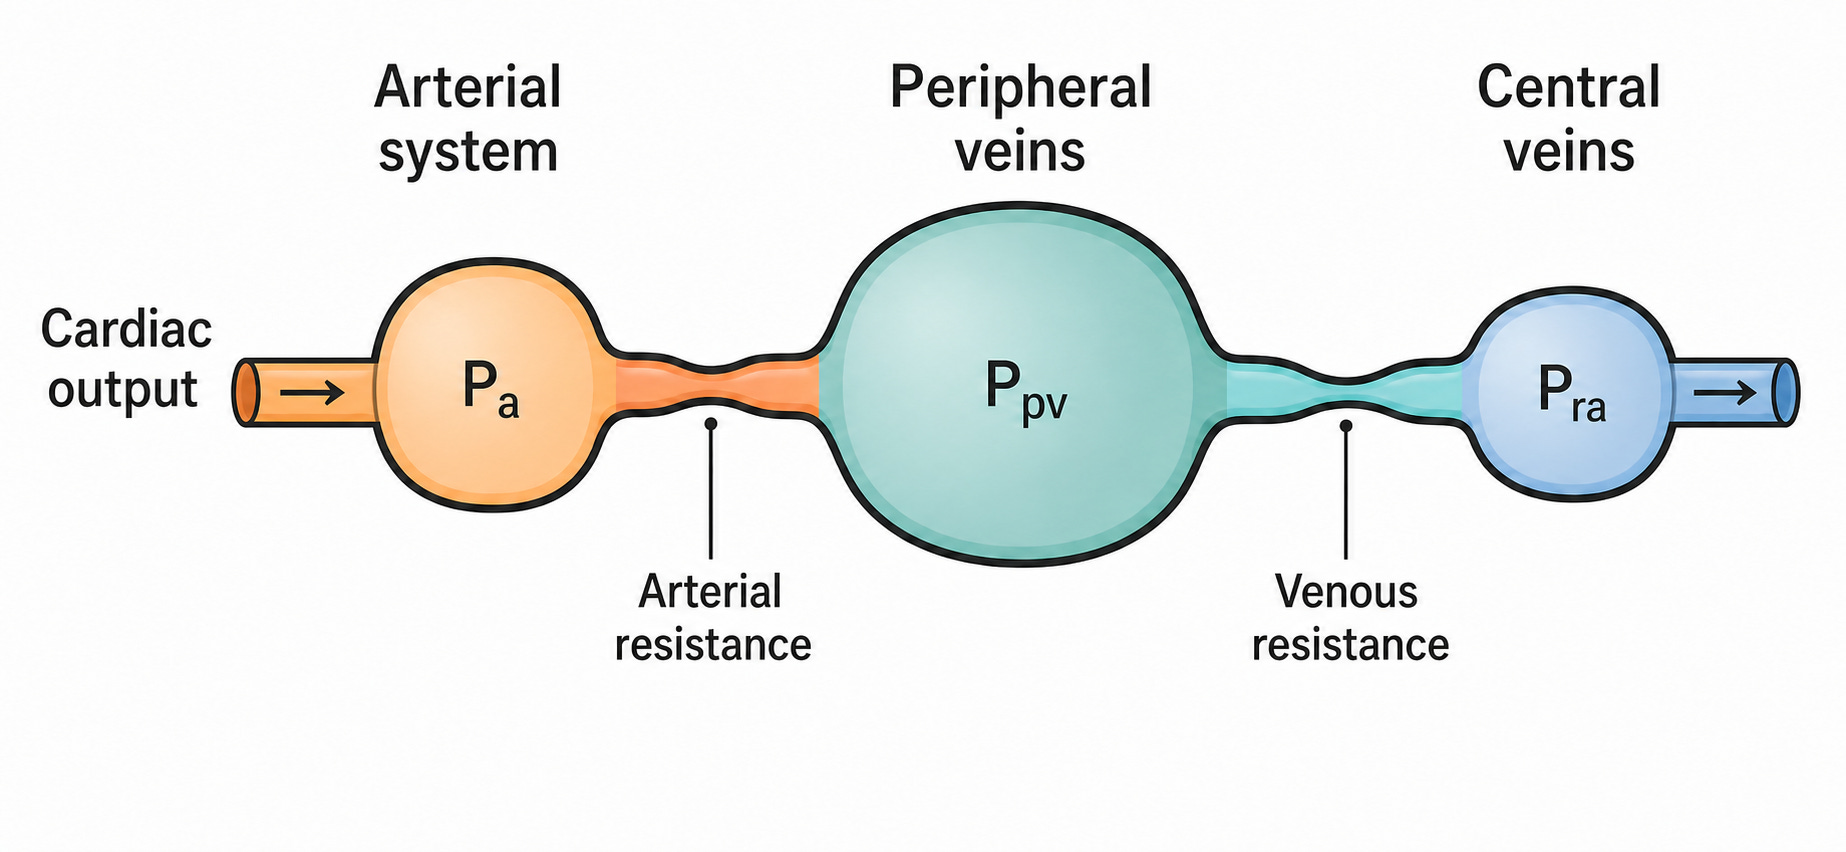
Author’s schematic, redrawn and adapted from the three-compartment vascular model presented in the upper panel of Fig. 9 of Brengelmann GL. A critical analysis of the view that right atrial pressure determines venous return. J Appl Physiol. 2003;94:849–859. https://doi.org/10.1152/japplphysiol.00868.2002. Original source © 2003 American Physiological Society.
The model was not intended to reproduce the full complexity of the circulation. Its purpose was to ask a narrower question: did the familiar venous return equation require a compartment that remained at Pms during flow?
At zero flow, no pressure differences were required across the resistances. Pressures in the three compartments equilibrated, and the common value was Pms. Blood distributed between the compartments according to their compliances. In this state, Pms had a clear physical meaning: it was the equilibrium pressure of the whole vascular system.
Once the pump produced flow, the compartments no longer shared a common pressure. Arterial pressure rose above Pms. Peripheral venous pressure and right atrial pressure fell below it. Volume moved into the arterial compartment and out of the venous compartments until each contained the amount appropriate to its new pressure.
No compartment remained fixed at Pms.
As flow was increased, the pressure profile became steeper, arterial volume increased, venous volumes decreased and right atrial pressure fell. The model generated the familiar near-linear relationship between flow and right atrial pressure, despite containing no reservoir at Pms.
The numerical crossing had not disappeared. Because arterial pressure was above Pms and right atrial pressure below it, every flowing pressure profile still crossed the numerical value of Pms somewhere. But the location of that crossing moved as flow changed. It was a feature of the pressure profile, not a compartment maintained at Pms.
The equation survives
The equations describing Brengelmann’s three-compartment model could still be rearranged into the familiar form:
Here, Req was an effective resistance calculated from the model’s regional resistances and capacitances, corresponding to what Guyton had described more broadly as the impedance to venous return.
The model therefore reproduced not only the experimental curve, but also the equation traditionally used to interpret it.
Pms entered the derivation because total vascular volume was fixed. At zero flow, that volume was distributed across the combined vascular compliances at the common equilibrium pressure Pms. During flow, the same volume was distributed among compartments with different pressures. When this conservation of volume was incorporated into the algebra, Pms appeared as a compact equilibrium reference.
The derivation had not discovered a vessel held at Pms. It had introduced the zero-flow equilibrium pressure while accounting for the same total blood volume under flowing conditions.
The denominator was also more complicated than its name suggested. Once Pms had been assigned to the small veins and venules, RVR invited an equally literal interpretation: a physical venous resistance lying between this upstream pressure and the right atrium, impeding the return of blood to the heart. But the apparent resistance defined by the slope was not simply the resistance of those veins. It was a composite determined by arterial and venous resistances together with the distribution of compliance across the vascular network. Guyton’s own quantitative work recognised this complexity and initially called it an impedance to venous return.
The reduced equation therefore described a genuine steady-state relationship: its slope and intercept were experimentally meaningful. But its form did not prove that the circulation contained the two-pressure, one-resistor circuit suggested by its appearance. The equation survived; the imagined hydraulic circuit did not.
The phantom gradient
None of this meant that pressure gradients were unreal.
During flow, neighbouring vascular segments possessed simultaneously existing local pressures. Blood passed through actual resistive pathways, and pressure fell along those pathways as mechanical energy was dissipated. These local pressure differences were real features of the flowing circulation.
The supposed gradient from Pms to right atrial pressure had a different status. Right atrial pressure was a local pressure in the flowing circulation, whereas Pms was the common equilibrium pressure reached when flow stopped. The equation made them look like opposite ends of a physical pathway, but no compartment maintained at Pms had been identified upstream of the right atrium.
This was unlike water flowing downhill, where the higher and lower elevations exist simultaneously and gravitational potential energy is released as the water descends. In the circulation, the heart supplies the energy and establishes the flowing pressure profile. The local pressure gradients along that pathway are real. The phantom was the idea that one of them began at Pms.
Brengelmann was not denying the reality of local venular pressure, the meaning of Pms at equilibrium, the importance of vascular volume and compliance, or the inverse steady relationship between flow and right atrial pressure. His criticism concerned the progression from one valid observation to a much larger physical claim:
A local venular pressure approximated Pms numerically. That pressure was therefore treated as Pms. Pms was then assumed to persist there during flow, supplying an upstream pressure opposed by right atrial pressure across a resistance to venous return.
Only the first observation followed from the pressure profile.
Rothe’s pivot still had descriptive value. It marked the crossover between vascular regions that gained and lost volume as the circulation moved between states. Its frequent location among veins and venules reflected where much of the vascular volume and compliance resided. But a moving crossover did not locate an equilibrium pressure within the flowing circulation.
The pivot was real as a crossing point. The pressure was real as a local pressure. The phantom was the identity assigned to it.
The energy warning
A second problem was already beginning to appear.
An elastic compartment can release stored energy while it loses volume and its walls recoil. That process can contribute to transient flow during redistribution. But once the compartment has reached a new steady volume and pressure, its walls are no longer shortening and it is no longer releasing additional elastic energy.
A reservoir whose pressure and volume remain fixed cannot continuously power its own outflow. If blood enters it at exactly the rate blood leaves, it becomes a passive conduit through which energy supplied elsewhere is transmitted.
Brengelmann would later make this objection central. For now, it was enough to see that removing a physical Pms reservoir did not make the vascular elastic state irrelevant. Blood volume, compliance and smooth-muscle tone still altered the pressure and volume distributions presented to the heart. Brengelmann’s ideal pump imposed flow; it showed how a fixed vascular volume redistributed at different flow rates, but did not ask how much flow a real heart could establish or sustain at a given vascular state.
Brengelmann had shown why Pms could not simply be placed upstream of venous return. He had not removed the elastic circulation from the argument.
What survived
Guyton’s greatest contribution remained intact.
The cardiac and vascular subdivisions could be studied through their separate open-loop relationships. In the cardiac subsystem, right atrial pressure influenced the flow produced by the heart. In the vascular subsystem, flow influenced the pressure and volume distribution that resulted in right atrial pressure. When the two were connected, the circulation settled at the one operating point compatible with both.
This framework allowed changes in cardiac function, blood volume and vascular properties to be understood as changes in the relationships whose intersection defined the steady state. Brengelmann did not reject that analysis. He rejected the idea that the vascular curve represented blood draining from a reservoir maintained at Pms.
Pms also survived. It remained a meaningful zero-flow equilibrium pressure and an aggregate expression of the relationship between blood volume and vascular accommodation. Brengelmann removed its supposed anatomical location and its role as a continuing source of energy during flow, not its meaning as a descriptor of the systemic elastic state.
But the defence of the reservoir had not yet been heard.
Brengelmann’s model had imposed flow; it had not determined whether a real heart could sustain any chosen flow without a change in vascular state. If Pms was not a pressure source sitting upstream of the right atrium, why did the elastic state of the circulation so clearly constrain the flow that could be sustained?
The heart might supply the energy. But perhaps the reservoir still determined how much blood could return to it.
Continued in Episode V: The Reservoir Awakens.
Previous episodes
Original paper
Brengelmann GL. A critical analysis of the view that right atrial pressure determines venous return. Journal of Applied Physiology. 2003;94:849–859. https://doi.org/10.1152/japplphysiol.00868.2002
Í think the deeper issue here is one of levels of description. Pressure, flow, volume, resistance, and compliance are macroscopic variables. They are not arbitrary abstractions—they are physically meaningful and extraordinarily useful—but they represent the collective behavior of a much more complex underlying system: molecular interactions, blood cells and plasma, vascular geometry, smooth muscle activity, elastin, collagen, and the mechanical properties of the vessel wall.
A remarkable recent example of this hierarchy comes from Deng. They rigorously derive the Boltzmann kinetic equation from the Newtonian dynamics of microscopic hard-sphere particles, providing the kinetic bridge toward macroscopic fluid equations such as Euler and Navier–Stokes. In other words, the macroscopic description does not compete with microscopic mechanics; it emerges from it.
This distinction matters when discussing pressure gradients and venous return. At the continuum level, a local pressure gradient is absolutely real and dynamically relevant: in the Navier–Stokes equations, is the force density acting on a fluid element. So I do not think the correct conclusion is that “pressure does not drive flow.” Locally, pressure gradients are part of the immediate mechanical description of how fluid is accelerated and transmitted through the vascular network (As I said before).
But this does not make the pressure gradient the ultimate source of the energy sustaining the circulation, nor does it mean that every pressure difference appearing in a reduced macroscopic equation necessarily represents a simultaneously existing physical gradient between two identifiable vascular locations. The pressure field itself has to be generated by the dynamics of the system.
This is why I find Brengelmann’s criticism of the literal interpretation of the Guytonian venous-return equation important. The relationship between Pms, right atrial pressure, and flow can be experimentally valid and physiologically useful without requiring us to interpret Pms as a physical reservoir continuously maintained upstream of the right atrium and supplying the energy for venous return. Brengelmann showed that the same steady-state relationship can emerge from conservation and redistribution of blood volume among compliant and resistive vascular compartments as flow changes. The equation may therefore survive even if the simple hydraulic picture suggested by the equation does not.
And this is perhaps the broader point: macroscopic variables compress enormous amounts of underlying physics. Pms, Pra, pressure gradients, resistance, and compliance can describe the circulation extremely well, but they do not by themselves tell us the complete causal history of how those states were generated. Beneath them lie redistribution of mass, vascular deformation, microscopic interactions, and the transfer, storage, and dissipation of energy.
So I would not frame the debate as “pressure gradients versus energy,” or as whether Pms is “real.” Both pressure and Pms are meaningful physical quantities at their appropriate level of description. The more interesting question is whether the causal interpretation we assign to a macroscopic relationship remains valid when we move across levels of description. A pressure gradient can be the immediate local mechanism by which mechanical energy is converted into fluid motion without being the ultimate origin of that energy; and a macroscopic equation can be remarkably predictive without being the final mechanistic explanation of the system.
That, to me, is the distinction we should preserve: description is not the same thing as ultimate causation, but neither does an emergent description become unreal simply because a deeper level exists.