
Episode I: A New Gradient
Venous Return Wars

A long time ago, in a laboratory far, far away, a new way of seeing the circulation was born…
Some papers change what we know. A few change how we think.
Arthur Guyton’s 1955 papers did something rarer still: they gave cardiovascular physiology a new way of seeing itself.
Before Guyton, physiologists understood many of the individual components of the cardiovascular system. The heart obeyed the Frank–Starling mechanism: as filling increased, the heart pumped more blood. Blood vessels were elastic structures that stored volume, generated pressure and resisted flow. Cardiac output, blood pressure and vascular resistance could all be measured.
Yet the circulation remained difficult to understand as a complete system.
The problem was deceptively simple: what determines cardiac output?
The obvious answer was the heart. After all, the heart was the pump. But Starling’s mechanism immediately created another question. If the heart pumps what it receives, what determines what it receives?
The circulation was a closed loop. The heart determined flow through the circulation, but the circulation determined the conditions presented back to the heart. Each side influenced the other, making it difficult to identify where cause ended and effect began.
Guyton’s insight was to break that circle conceptually.
He separated the circulation into two interacting systems: a cardiac function describing the relationship between filling and output, and a vascular function describing the relationship between the systemic circulation, flow and right atrial pressure.
Study them separately. Then put them back together. Where those two relationships intersected, the entire circulation found its equilibrium.
Cardiac output and venous return were not competing explanations of flow. They were two views of the same circulation seen from opposite sides of the loop.
It was an extraordinarily powerful idea. In a single diagram, Guyton united Starling’s law, vascular properties and cardiac output into one coherent picture. Physiologists could now visualise how changes in blood volume, vascular tone or cardiac function shifted the operating point of the entire circulation.
Few papers have influenced cardiovascular physiology more profoundly.
But every powerful idea carries a hidden danger. Sometimes the way we draw a diagram changes the way we think, and sometimes the language we use to describe a relationship instead becomes a story about cause and effect.
That is where the venous return wars began.
Separating the inseparable
Studying a closed loop creates a fundamental problem: everything affects everything else.
If cardiac output increases, blood redistributes between different parts of the circulation. Pressures change. Volumes change. The conditions for venous return change. Conversely, if venous return changes, cardiac filling changes, the heart responds, and cardiac output changes.
Guyton’s solution was both simple and brilliant. He opened the loop.
In experimental preparations, the heart and systemic circulation were separated. The heart could be replaced by a mechanical pump, allowing the behaviour of the vascular system to be studied independently.
The technical details were ingenious and would later become part of the controversy, but the conceptual aim was clear: study the properties of the circulation independently of the heart.
By changing pump flow and observing the resulting pressures, Guyton could describe the relationship between blood flow through the vascular system and right atrial pressure.
The result was the venous return curve.
At high flows, right atrial pressure was low. At lower flows, right atrial pressure rose. When flow stopped completely, pressure throughout the circulation equilibrated at a single value.
Guyton called this the mean circulatory filling pressure.
This represented something fundamental: the pressure generated by the blood volume contained within the elastic vascular system when flow had ceased.
The circulation was not simply a collection of tubes. It was an elastic container capable of storing energy.
A New Gradient
Mean circulatory filling pressure was not a new observation. Physiologists already knew that when the heart stopped and flow ceased, pressures throughout the circulation equilibrated to a common value.
Guyton’s insight was to recognise that this equilibrium pressure contained important information about the vascular system itself.
The circulation was not simply a passive network of vessels waiting for the heart to pull blood through it. It had its own properties. Blood volume, vascular elasticity and resistance determined the relationship between the vascular system and the flow returning to the heart.
Guyton made the conceptual leap that would define venous return physiology for the next seventy years.
If the circulation had an equilibrium pressure when flow stopped, and the right atrium had a pressure where blood returned to the heart, then the difference between these pressures could be described as a gradient.
The model appeared intuitive: mean circulatory filling pressure on one side, right atrial pressure on the other, with the resistance and capacitance properties of the vascular system lying between them.
Venous return could therefore be expressed as:
VR = (MCFP − RAP) / ZVR
where VR is venous return, MCFP is mean circulatory filling pressure, RAP is right atrial pressure, and ZVR is the impedance to venous return.
It was elegant, powerful, and captured something clinicians recognised intuitively. Increasing blood volume or constricting veins increased mean circulatory filling pressure and shifted the system towards greater flow. Weakening the heart caused blood to accumulate upstream and increased right atrial pressure.
The framework explained why neither the heart nor the circulation alone controlled cardiac output. Guyton had created a model of a coupled system.
The next step would transform this idea into one of the most famous diagrams in physiology.
The most famous graph in physiology
The final step was Guyton’s masterstroke.
He had described two relationships. The first was the familiar cardiac function curve: the relationship between filling pressure and cardiac output described by Starling. The second was the venous return curve: the relationship between flow through the systemic circulation and right atrial pressure.
Individually, each relationship described only half of the system. Together, they created something entirely new.
Guyton placed both curves on the same graph. The point where they crossed represented the only state compatible with both the heart and the circulation. At that point, cardiac output and venous return were equal, and the corresponding right atrial pressure was the value that satisfied both systems.
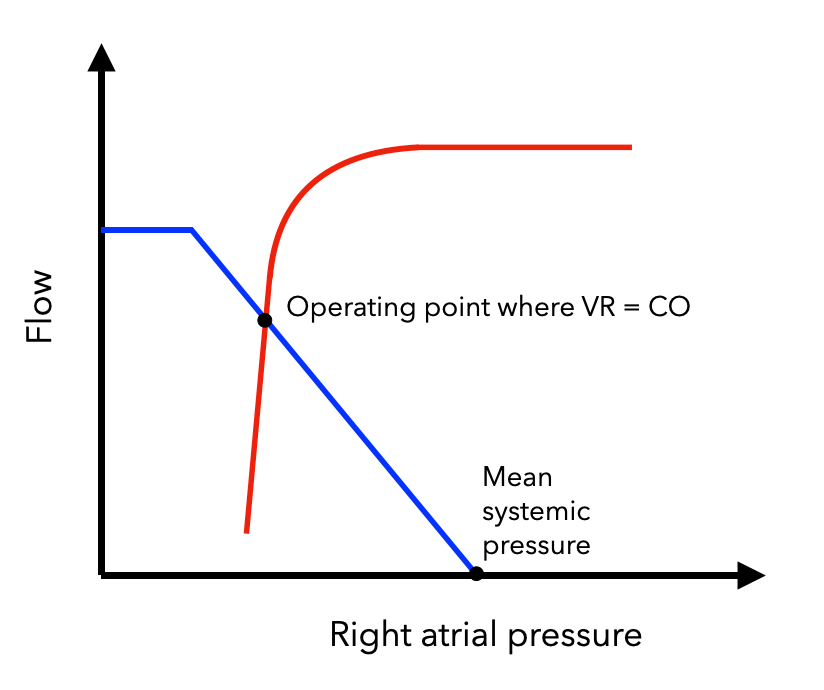
This was the true power of the model.
Right atrial pressure was not chosen by the heart. Cardiac output was not chosen by the circulation. Both emerged from the interaction between the pumping characteristics of the heart and the physical properties of the vascular system.
Guyton transformed the circulation from a collection of separate components into an integrated system.
Changes that previously seemed complex could now be visualised. Increased blood volume altered the vascular curve. Impaired cardiac function altered the cardiac curve. The new intersection predicted the new cardiovascular state.
It was elegant, intuitive and clinically useful.
Most importantly, it demonstrated something that remains true today: neither the heart nor the circulation independently determines cardiac output. Flow emerges from the interaction between both.
A disturbance in the Force
But every powerful model carries a risk. The clearer an idea becomes, the easier it is to forget what has been simplified.
Guyton’s diagram made a complex interaction visible. It placed mean circulatory filling pressure, right atrial pressure, venous return and cardiac output onto a single set of axes. That was its genius.
It was also its danger.
The eye naturally reads a graph as a causal story. One variable sits on the horizontal axis. Another rises or falls on the vertical axis. A line connects them. Before long, a relationship starts to look like a mechanism.
The venous return curve invited exactly that reading.
Mean circulatory filling pressure on one side. Right atrial pressure on the other. A gradient between them.
The mathematics described a relationship between variables in a coupled system.
The picture looked like a mechanism.
The war begins
Perhaps the most fascinating part of this story is that Guyton seemed to recognise the problem, but never fully escaped it.
In the same paper that introduced his famous curves, he acknowledged that right atrial pressure was not a primary determinant of cardiac output. It was determined simultaneously with cardiac output by the interaction between the heart and vascular system.
That was the systems physiologist speaking.
But elsewhere in the same work, Guyton used a very different language. Right atrial pressure was described as a back pressure. It opposed venous return. Mean circulatory filling pressure promoted venous return and was described as a force tending to push blood toward the right atrium. The difference between them was the pressure gradient for venous return.
‘It is quite obvious that the greater the right atrial pressure, the greater is the back pressure in the veins preventing the return of blood to the heart.’
‘…it can be seen that right atrial pressure opposes the return of blood to the heart while the mean circulatory filling pressure promotes the return of blood to the heart…This difference between mean circulatory filling pressure and right atrial pressure can be called the pressure gradient of venous flow.’
That was the language that stuck. And it stuck because it was so easy to understand.
A pressure difference. A resistance. A flow.
The equation looked familiar. The diagram looked familiar. The language invited a simple mental model: blood flowing from mean circulatory filling pressure towards the right atrium, with right atrial pressure acting as the downstream pressure holding it back.
The problem was not that this was mathematically useless. The problem was that it sounded mechanistic.
A model designed to describe equilibrium began to look like a model explaining cause and effect.
Guyton did not invent the later misconception out of thin air, but he did give it much of its vocabulary.
That is why the venous return wars are so interesting. The conflict was not between a brilliant physiologist and confused readers. It was already present inside the original papers: an elegant systems model described in language that made the system look like a simple pressure-driven pipe.
For more than two decades, the gradient shaped how generations of physiologists and clinicians thought about venous return.
Then, in 1979, Matthew Levy looked again at Guyton’s famous curves and asked a different question.
Not:
What determines venous return?
But:
Which variable is actually being determined?
The numerator was about to strike back…
Continued in Episode 2: The Numerator Strikes Back
Follow the Venous Return Wars as we revisit the original papers, the arguments they created, and what they reveal about how the circulation really works.
Ancient texts
Guyton AC, Lindsey AW, Kaufmann BN. Effect of mean circulatory filling pressure and other peripheral circulatory factors on cardiac output. Am J Physiol. 1955;180:463–468.
Guyton AC. Determination of cardiac output by equating venous return curves with cardiac response curves.Physiol Rev. 1955;35:123–129.
👏👏👏👏👏🙌